BiZen

Client Case Studies

BI-ZEN provides bespoke IIoT-enabled dashboard solutions that simplify complex processes into actionable process and business intelligence.

Sample Data Validation (Labs v Site & Sensor Findings)

Problem statement

Assess confidence levels between external lab data and onsite sensor & test measurements

To exploit and increase the added value extracted from granular data sets obtained from sensors, it is imperative to gain client confidence regarding the adoption of sensor-based monitoring, over conventional sample collection and analysis surveys.

Problem statement

What we did

Duplicate samples issued to independent UKAS labs, assessed against sensor data, and controlled on site testing

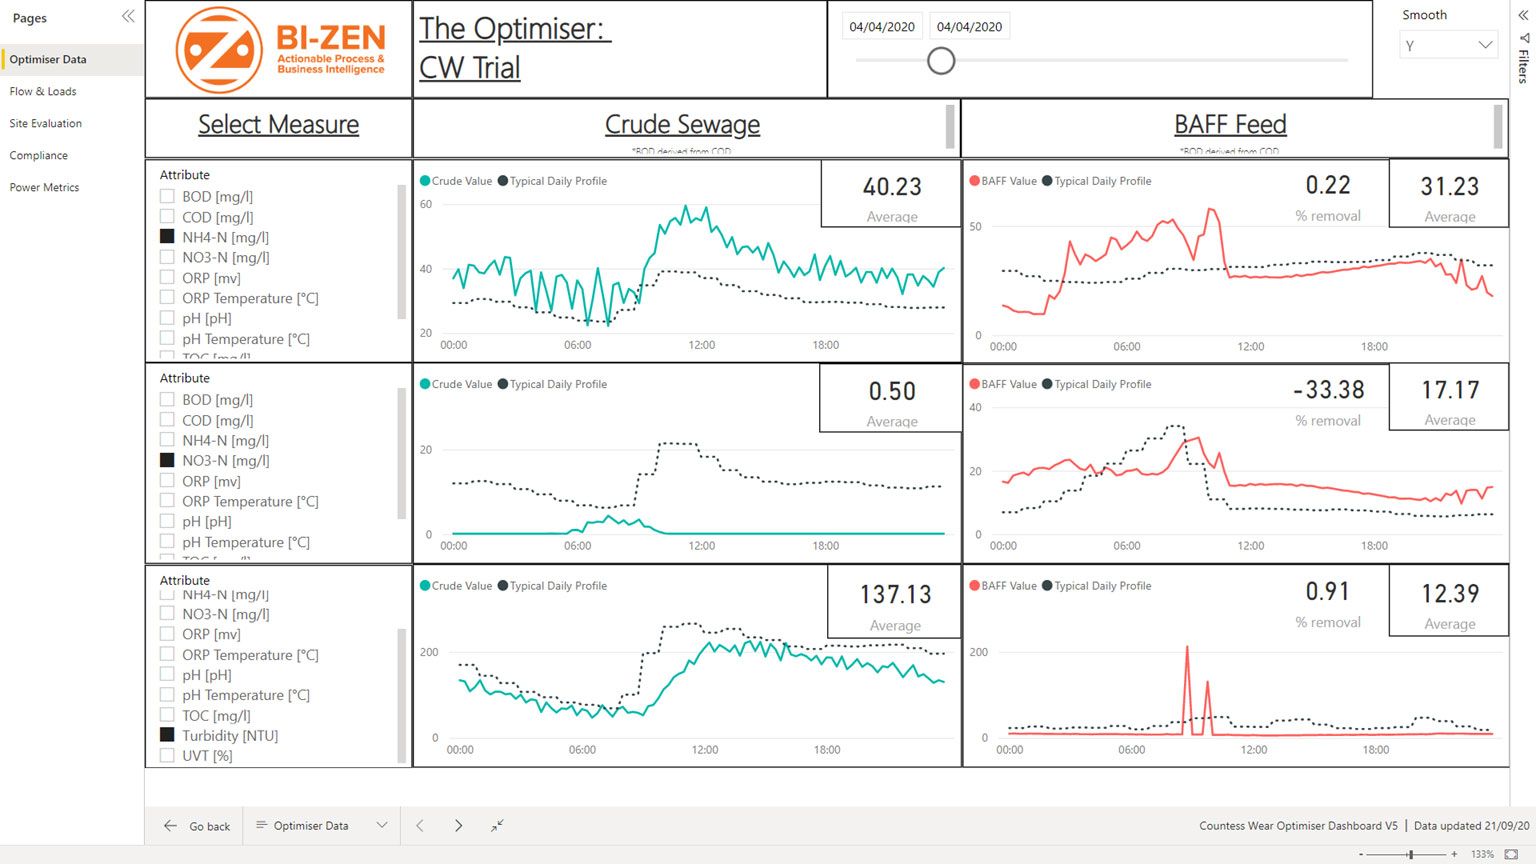
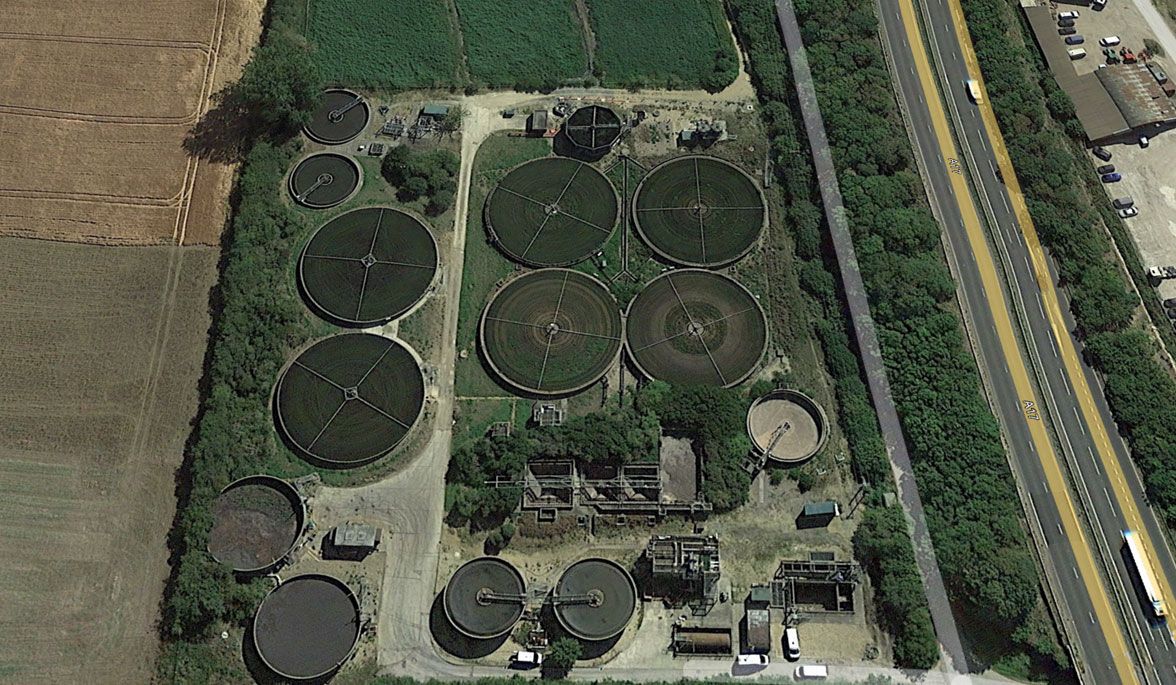
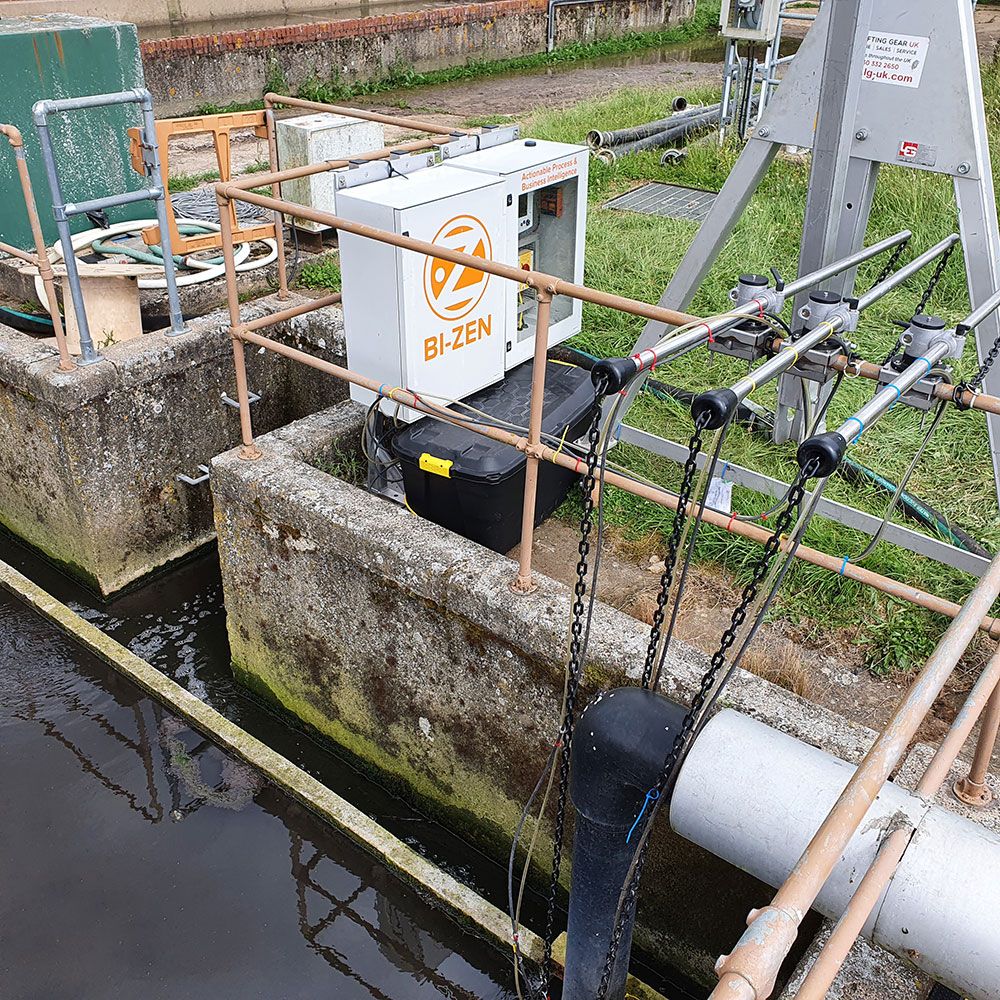
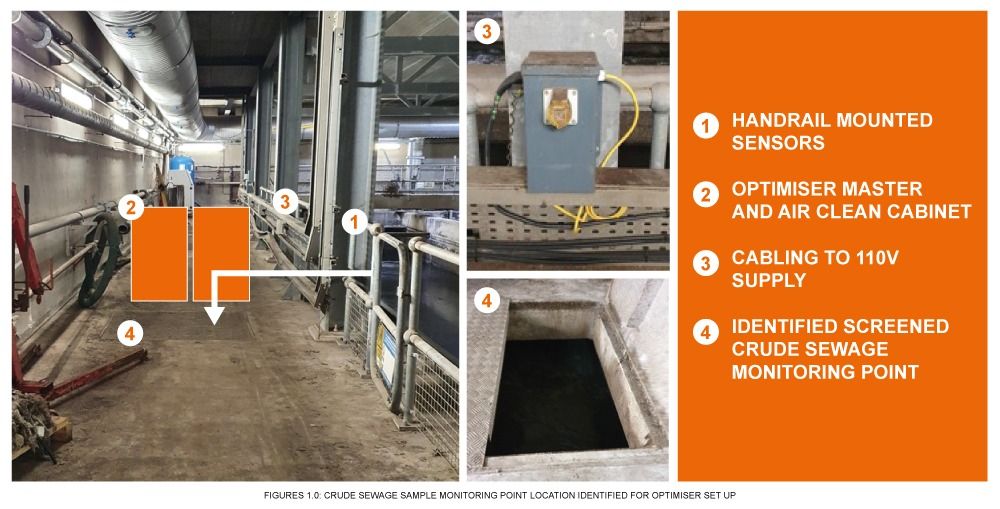
While at a large UK wastewater site, BI-ZEN recently conducted a validation programme comparing calibrated sensor data, coupled with internal quality control lab analysis, against the results of two independent UKAS laboratories.

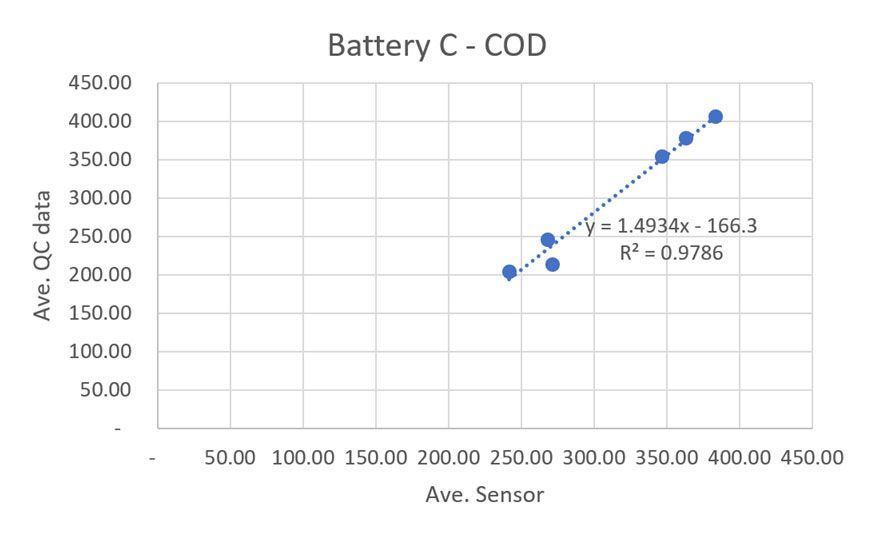
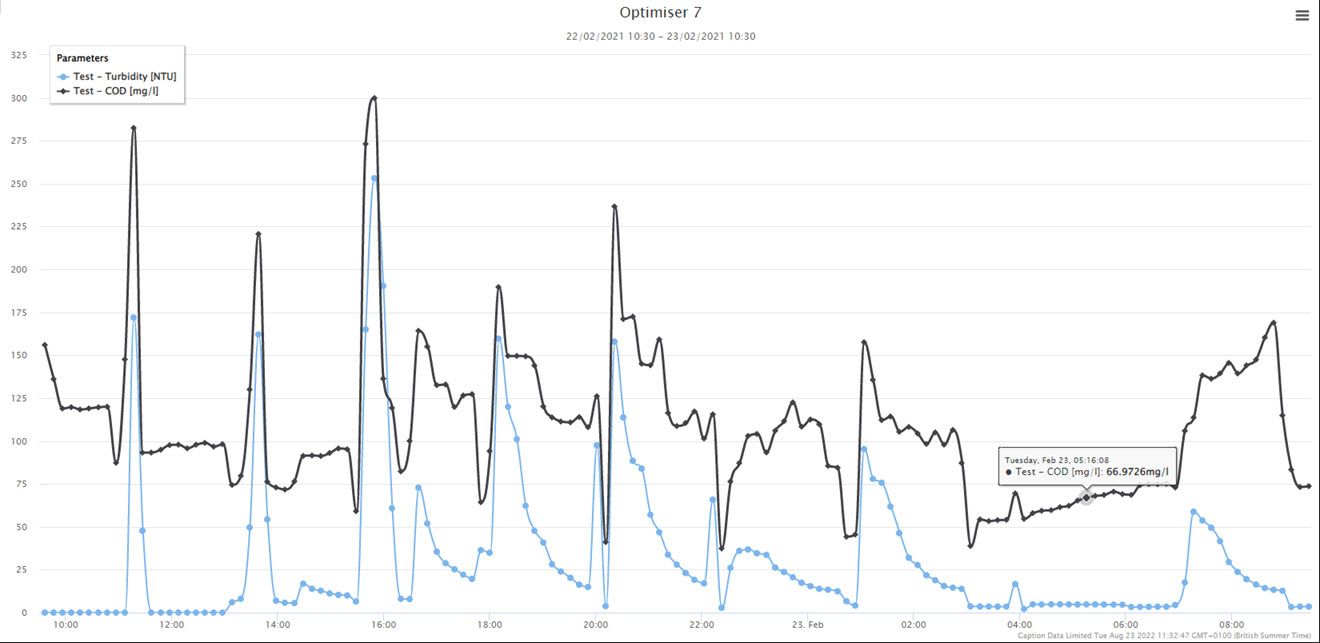
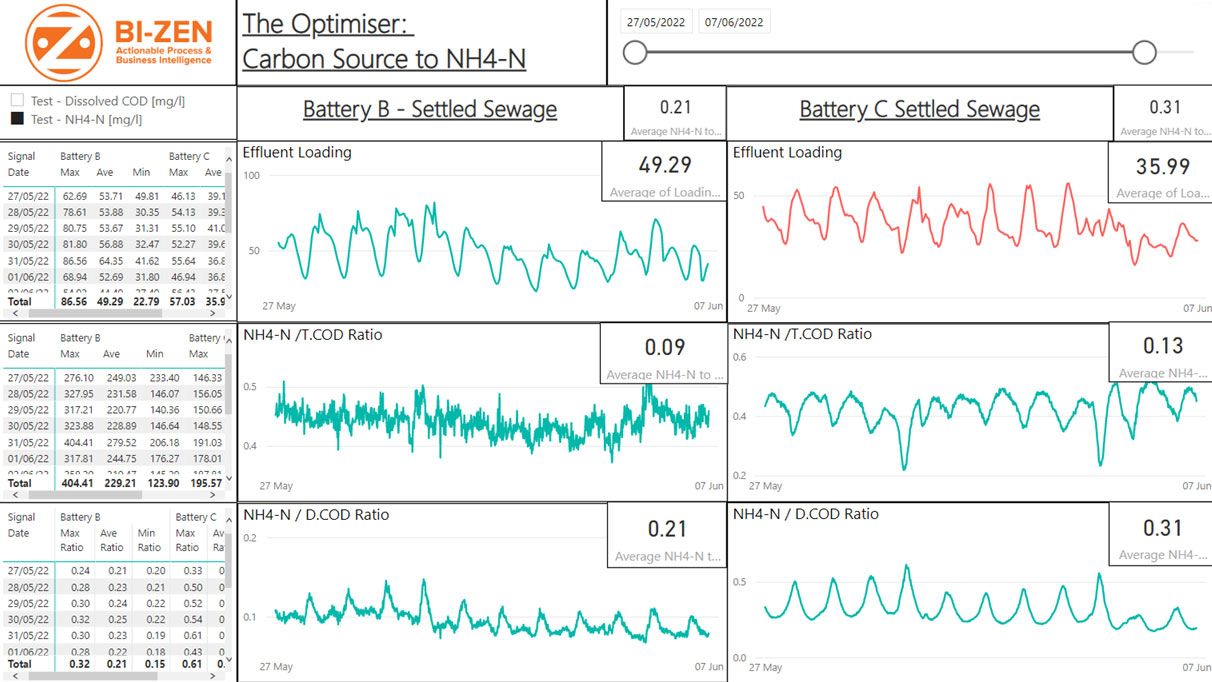
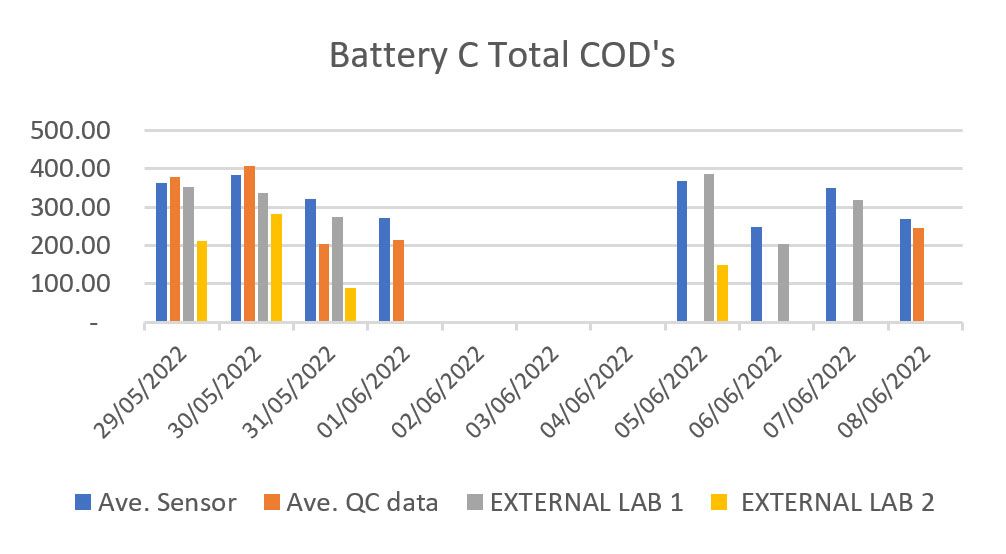
Each sample issued to the external labs are analysed once, following standard procedures. BI-ZEN test each sample twice and on occasion in triplicate, to ensure no outliers occurred between each test, as a number of tests only use 0.2ml of effluent sample which leaves little room for error. The following charts summarise the comparative results between the sensor and onsite lab results – indicating a high level of correlation.

It must be noted that the sensors take a measurement every 1minute and the internal quality control onsite lab analysis is typically analysed within hours of sample extraction, therefore minimising the potential for any sample degradation.

The following charts compare some of the results received from the external accredited labs, presented against the sensor and onsite test results.

As can be seen there are significant inconsistencies within the received data sets, with one external lab generating significant outliers and proven to be unrepresentative results. This activity has since been repeated comparing other UK labs, which have also displayed similar inconsistencies between reported duplicate results.

Sample Data Validation (Labs v Site & Sensor Findings)

Key Benefits

What does this mean:

  • Confidence in sensor-based monitoring can be achieved
  • Capital design schemes informed by limited conventional lab data sets may carry inherent risks that could compromise the final project outcome.

Site 01: Carbonaceous ASP with N. BAF

PE: 164,056

Problem statement

Technical Evaluation to enable CAPEX avoidance for a growth scheme

The 165,000 PE works incorporating carbonaceous ASP, nitrifying BAF, as well as a strategic anaerobic digestion sludge treatment centre is at full capacity. Further process capacity concerns are linked to local development plans for project growth.

A notional solution to install additional N.BAFF cells to compliment an AMP5 scheme has been considered and are costly (ex. £3 million). The client required an appraisal to determine other technical options, as well as quantification of actual performance of the works treatment load and asset performance.

What we did

Strategic evaluation of design capacity validated with digital live data

Two Optimiser units were deployed in early March just before the national Covid-19 lock down. The units were retained on site for the duration of 3 to 4 months benefiting the client with a rich data set of a large city, pre- and post-lock down. The duration offered the potential for operators to monitor process performance from their homes, as well as giving the opportunity to determine the sensor reliability when left in situ for a sustained period.

With both the Optimiser, as well as key SCADA data being surfaced to the cloud, effective integration of the data set could be readily achieved. This enabled an assessment of periods when assets were operating close to their design capacity.

In collaboration with the client’s operational team, informed interventions to optimise the works assets were conducted. The provided tools enabled rapid evaluations to take place and efficient quantification of the results to be communicated to all stakeholders.

Site 01: Carbonaceous ASP with N. BAF

Key Benefits

To sustain any interventions, you need to understand what is right for your plant, people and infrastructure. Our optimiser solution gets you on the right track.

  • Unmatched site-specific process insights
  • One version of the truth, reducing process risk
  • Strategically valuable toolkit to meet AMP7 challenges
  • Rapid results with the right focus to implement change and immediately monitor the benefits.

Site 02: PST & Bio-P Optimisation

PE: 325,000

Problem statement

Optimum PST and Bio-P process

The 325,000 PE works incorporates 6 no. primary settlement tanks (PST’s), enhanced biological removal (Bio-P) in the anaerobic, anoxic, aerobic configuration, followed 4 no. final settlement tanks. The site is also a strategic sludge reception facility, with THP digestion, as well as a Sharon return liquor plant.

The Bio P process is influenced by the availability of VFA (soluble carbon source) with some load generated from a trader, and any shortfall in VFA supplemented by retainment of a high sludge blanket in the PST’s, as well as the addition of Glycol dosing as required.

Despite extensive conventional sampling programmes, the client had not been able to quantify the performance of the PST’s organic matter removal rates, as well as any associated phosphorus release and VFA generation potential.

What we did

Cost to serve data in real time & sustained optimisation at zero cost

Two Optimisers were deployed, one on the inlet to the works, downstream of the return liquors, the other on the outlet of one PST. A battery operated, IoT linked, sludge blanket detector was also installed on the PST.

In collaboration with the site operational team, sludge blanket levels were adjusted during the trial. Data captured from the Optimisers and sludge blanket monitor was pushed to the cloud, including key SCADA data. By incorporating flow to treatment, return liquor pump operation, process monitoring data, in addition to asset capacity and technical design standards, a comprehensive dashboard was established.

The dashboard was designed to derive the financial impact on treatment performance, at varying sludge levels. Equating the increased energy for treatment, when linked to reduced PST organic removals, as well as the value of the VFA release, from the sludge that benefits the Bio-P process. With such a rich data set, presented within an easy to interpret dashboard, the team were able to derive an optimum sludge blanket level. Noting the tipping point between optimum VFA production, and prevention of re-solubilisation of bound up Phosphorus from the sludge blanket. The final benefits are still being processed, but conversative estimates are over £150k/pa, with no change to the assets and operator resourcing.

Without the Optimiser a full understanding of PST operation could not be achieved, which is an industry challenge not unique to our client.

Site 02: PST & Bio-P Optimisation

Key Benefits

To sustain any interventions, you need to understand what is right for your plant, people and infrastructure. Our optimiser solution gets you on the right track.

  • The mobile Optimiser rigs, including sludge blanket monitoring, can be rapidly deployed to support any R&D / process handover scheme.
  • Data sets are un-matched, filling the void in current process monitoring, and a route to greater process insights and innovation.
  • Evidencing and then equating simple metrics, like PST sludge blankets to financials, empowers operators to make informed changes to the operation.

Site 03: Filter works with new storm permit

PE: 22,500

Problem statement

Quantification of Storm Loads and Capex avoidance

The 22,500 PE works incorporates primary settlement, biological filters, humus settlement tanks (HST’s), nitrifying tower filters (N. filters) with tertiary filtration.

The works is subject to a new full flow to treatment permit, requiring the construction of a side stream storm treatment process. In addition, there was concern over the performance of the HST for solids capture.

Conventional sampling programmes had failed to capture storm events, to inform on the design of the new side stream process, as well as quantify interstage asset performance.

What we did

Captured un-matched storm data & proved a zero build opportunity

Two Optimisers were deployed, one on the inlet and the other on the HST outlet, to capture COD, NH4-N, NO3-N, Turbidity, Redox, pH and temperature. The data was fed, with surfaced clients flow data, into a site-specific dashboard. To report on asset process and hydraulic loading rates, under varying conditions, including storm events.

With data obtained every minute, and packaged into 15min increments, the client was able to capture periods, great and small, when the works was going to storm. Generating a rich data set informing on first flush conditions, through to prolonged storm events, enabling the client to de-risk the design of the future plant upgrades.

Outputs also included quantification of the HST solids capture, under varying hydraulic loading conditions, efficiently proving that the solids capture was maintained, even when the technical standards were exceeded. With the data presented in easy to assimilate dashboards, operational acceptance that additional HST capacity could be avoided, was effectively communicated to the business. A conventional sampling programme would not have provided the equivalent repeatable evidence, to support such a robust challenge of the technical standards, leading to unnecessary capital spend and potential operational difficulties within the future operation of the plant

Site 03: Filter works with new storm permit

Key Benefits

To sustain any interventions, you need to understand what is right for your plant, people and infrastructure. Our optimiser solution gets you on the right track.

  • The tools to measure key storm events, both large and small.
  • Dashboards that incorporate asset data, to efficiently evaluate actual performance, against the installed capacity.
  • Cloud-based tools that facilitate easy interpretation of process performance and identify opportunities to de-risk and optimise design decisions.
  • Data to challenge conservative design standards, leading to CAPEX avoidance.

Site 04: SBR with N. Filters

PE: 20,000

Problem statement

Improve asset operation to decommission an adjacent old works

The 20,000 PE works incorporates carbonaceous Sequencing Batch Reactors (SBR’s) followed by Nitrifying tower filters (N. Filters) to meet a tight Ammonia permit. The SBR includes a large proportion of aerated fill, with an associated long sludge age, contributing to filamentous bacteria issues and inconsistent loading onto the N. Filter. With poor solids settlement, and unreliable nitrification, over pumping to the adjacent old works was required to complete treatment of the effluent. The client required detailed insights, to inform on the operational and design needs that would support interventions to facilitate the decommissioning of the old works. As well as ensure robust operational control was secured from the existing asset base.

What we did

Strategic evaluation of design capacity validated with digital live data

Within two weeks of first contact, two Optimisers were deployed in early February 2021, one on the feed to the SBR, and one on the outlet. By surfacing flow data, on top of the IoT enabled sensors from the Optimiser, a high level ‘Digital Twin’ was developed within days of mobilising onsite. The clear-cut cloud-based dashboards enabled the client to understand the current plant operation, and its process limitations quickly and efficiently. The insights from the dashboards measured the loading into the works, and quantified actual performance of the SBR, and the inconsistent loading onto the downstream nitrifying filters.

By the third day, clear trends where identified, evidencing defined periods when the SBR was completely nitrifying, but more surprisingly fill cycles when the SBR decanter was letting-by. A quick win, within hours of receiving the data, was linking the decanter issues with rag blockages on non-return valves.

The Optimiser dashboards efficiently evidenced inconsistent ammonia loading, periods of high solids, and organic load break through, onto the downstream N. filters. This would have been missed during a conventional flow & load survey.

Site 04: SBR with N. Filters

Key Benefits

To sustain any interventions, you need to understand what is right for your plant, people and infrastructure. Our optimiser solution gets you on the right track.

  • Rapid and clear digital twin tools, informing on operational and design limits.
  • Tools to quantify the causation of issues, enabling clients to regain headroom from the installed asset base.
  • Unmatched granular insights that would be missed during a conventional flow & load survey.
  • More cost effective and quicker than conventional approaches.

Site 05: Filter nitrification optimisation

PE: 2,800

Problem statement

Can the works be optimised to avoid capital spend?

The case study site is a small biological filter works, serving a population equivalent of 2,826 people. With growth in the catchment, intervention was required to ensure the works maintained its Ammonia treatment compliance.

Historical sample data sets identified that the works performance was borderline, and intervention options included capital upgrades, as well as low-cost opportunities to optimise the existing assets.

An optimisation programme of works involved a trial to monitor the benefit of increasing the works filter wetting rate, by means of temporarily upgrading the works recirculation capacity. To determine if nitrification performance, in summer low flow dry periods, could be sustained.

What we did

Identified peak loading events that would have been missed.

To validate any biological treatment benefits from the recirculation enhancements, the monitoring duration needed to span several weeks. This can be costly using the conventional sampling approach and hold risk if data gaps are missed. As a result, the client used the Optimiser, with the positioning of NH4-N, NO3-N, Turbidity, pH & Temperature fixed sensors within the humus tank outlet. The 1 minute, digital Optimiser data sets, where fed into bespoke dashboards, that incorporated client flow and asset capacity data. The digital tools enabled the client to understand the current plant operation, and its process limitations quickly and efficiently.

Insights from the dashboards highlighted that the site received daily morning peak loading events, that would have been missed when using a conventional sampling programme of works. The data clearly evidenced that Ammonia compliance was at risk for only short periods in the day. As a result, capital intervention is now focusing on cost effective hydraulic management interventions, to control the peak loads, which will be more beneficial, sustainable, and cost effective than the conventional media upgrades.

Site 05: Filter nitrification optimisation

Key Benefits

Dynamic process performance assessment tools backed with un-matched granular data: Rapid & efficient process insights. The works is operating at FFT, and a peak Ammonia load every morning.

  • Rapid and clear digital dashboard tools, informing on operational and design limits.
  • Tools to quantify the causation of issues, enabling clients to regain headroom from the installed asset base.
  • Unmatched granular insights that would be missed during a conventional flow & load survey.
  • More cost effective and quicker than conventional approaches.

Site 06: AMP7 Upgrade – Nitrate management

PE: 2,070,000

Problem statement

Determine why denitrification is poor within a process stream

One of the UK’s largest sites operates across five different catchment fed process batteries, serving approximately 2.1 million people. Intervention options under a growth scheme look to optimise the existing Battery C capacity that is reportedly operated to two thirds of the hydraulic throughput. The throughput is restricted due to unwanted part dentification taking place within the FST’s. Other than Lane 18, battery C does not have Anoxic zones.

The Optimiser was deployed to assist the delivery partner Mott MacDonald with the quantification of the current weak performance Lane 18 Anoxic zone, by assessing the performance of the Anoxic zone in Battery B as a reference. To determine if there is potential in the provision of additional anoxic zones on Battery C that will enable the process train to accept more flow.

What we did

1-minute trended insights into settled sewage composition & anoxic zone performance

A pair of Optimisers were first deployed within the settled sewage chambers of Battery B & C. By surfacing flow data, on top of the IoT enabled sensors from the Optimisers, comparisons of the respective loading profile and NH4-N to soluble carbon source was captured. On the second week the Optimisers were relocated to the inlet and outlet of Lane 18 Anoxic zone.

With the data surfaced to bespoke cloud-based dashboards, BI-ZEN was able to evidence for the client that current plant operation could not work, as well as point to process limitations that have significant impact on future design considerations.

The Optimiser dashboards were configured to display diurnal trends (sourced from 1 minute data sets) proving that denitrification was not always taking place, as well as highlighting that due to Battery C’s catchment, a conventional approach to anoxic tank design on Battery C would not work. Using the Optimiser data, the client can evidence that the catchment feeding Battery C is significantly different to the other catchments feeding into the works. Identifying low soluble carbon coupled with high NH4-N concentrations are feeding into Battery C that do not favour conditions for complete denitrification. This would have been missed during a conventional flow & load survey and has prompted a Systems Thinking approach to the design solution.

Site 06: AMP7 Upgrade – Nitrate management

Key Benefits

Rapid & efficient process insights Efficient data presentation and interpretation that would be missed using the conventional approach.

-Rapid and clear cloud-based analytics tools, informing on operational and design limits. -Tools to quantify the causation of issues, enabling clients to regain headroom from the installed asset base. -Unmatched granular insights that would be missed during a conventional flow & load survey. -More cost effective, accurate and quicker than conventional approaches.

Site 07+08: Combining two works

PE: 183,000 & 130,650

Problem statement

Determine the Population Equivalent for comparison to historical records

An underground works built in 1998 carried high operational costs to maintain in addition to health and safety challenges around the handling and managing of odours, as well as H2S within an enclosed space.

An opportunity to abandon the site and pump away the effluent to another works had been identified, which was influenced on cost to maintain the asset as well as the land resale value.

Understanding the sewage loading profile to both works was required in addition to quantification of potential saline infiltration at one site, as well as eroded process headroom from digestate return liquors at the other site.

What we did

Managed a safe deployment under challenging conditions

Within two weeks of first contact, an Optimiser was deployed at the inlet of each works in late April 2022. The first site was partly underground operating down stream of failed inlet screens with poor rag capture and within an area susceptible to H2S exposure. The BI-ZEN team generated an appropriate RAMS and safe systems of work, to comply with site safety procedures when working within a potentially hazardous area. In addition, in collaboration with the site personnel as well as remote monitoring of the generated data, potential sensor rag contamination and data compromise was overcome due to the diligence by all parties. At the second site significant flow variation was noted, because of numerous catchment pumping stations. The Optimiser sensors were able to distinguish the concentrations between the varying pumped locations, as well as validate NH4-N load contribution of digester liquor return data sets.

On top of displaying good examples of safe and collaborative working with the client, a potential 20% reduction from the Optimiser measured values against historical client data was evidenced, as well as quantification of saline infiltration profiles. This has informed on design optimisation opportunities that would have been missed during a conventional and potentially conservative flow & load survey.

Site 07+08: Combining two works

Key Benefits

Safe working on top of unmatched data insights Safely managed deployments generating informative data sets First flush conditions easily identified

  • Adaptive and responsive safety practises.
  • Efficient surveys managed remotely, to ensure data capture is maintained and not compromised in the event of sensor contamination.
  • Provision of granular data sets within easily assimilated cloud-based dashboards that evidence actual events and opportunities for design efficiency.